The Economic Impact of Child Care

Report: The Economic Impact of Child Care (2019)
Parents need child care in order to obtain and retain a job. Children need a safe place to be that promotes their healthy development while their parents are working. The child care industry is an important economic driver within states. In fact, throughout the country, child care has an economic impact of $99.3 billion.
The Committee for Economic Development (CED) reviewed the economic impact of child care in a 2019 report, Child Care in State Economies. At that time, as an industry throughout the country, child care had revenue of $47.2 billion, employing 1.5 million workers. The spillover impact of these programs (purchases of goods and services) generated an additional $52.1 billion in local economies for a total economic impact of $99.3 billion.
Child care plays a major role in New Jersey’s economy. The child care and early education industry:
- generates more than $4.1 billion annually
- creates approximately 67,098 full-time jobs each year
- enables a working-parent labor force in New Jersey;
- drives labor force productivity by reducing absenteeism and turnover and improves recruitment within the workplace
- enables parents to work and supports the healthy development of children while parents are working
CED New Jersey Economic Impact Fact Sheet
CED New Jersey Economic Impact Talking Points
CED New Jersey Economic Impact Infographic

Committee for Economic Development, 2019
The Economic Role of Paid Child Care in the U.S. (2022)
An Interactive Gallery Dashboard
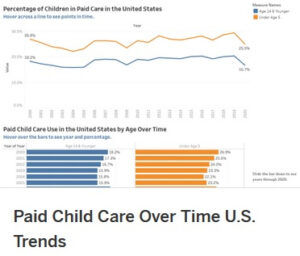
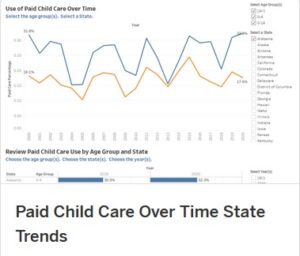
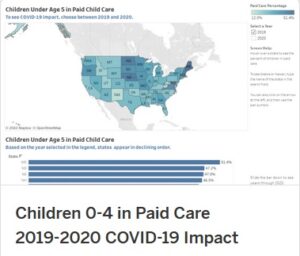
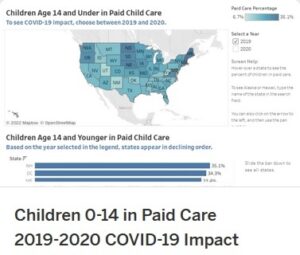
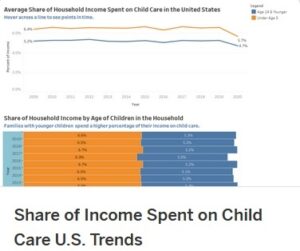
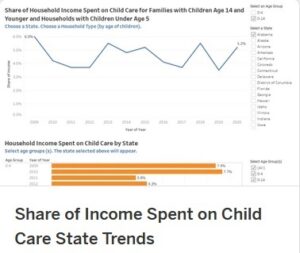
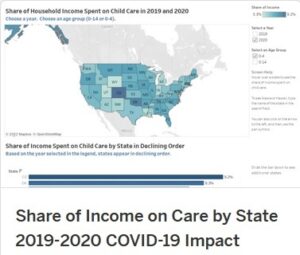
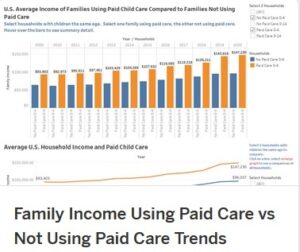
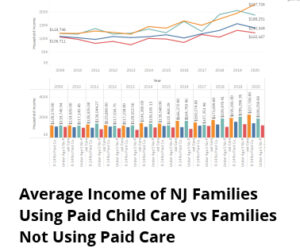
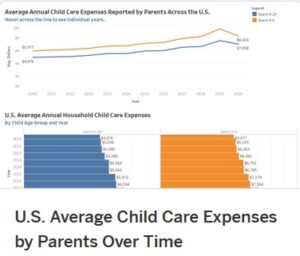
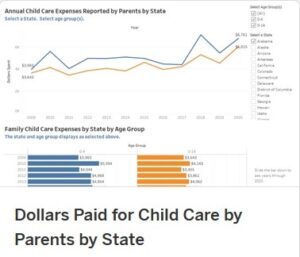
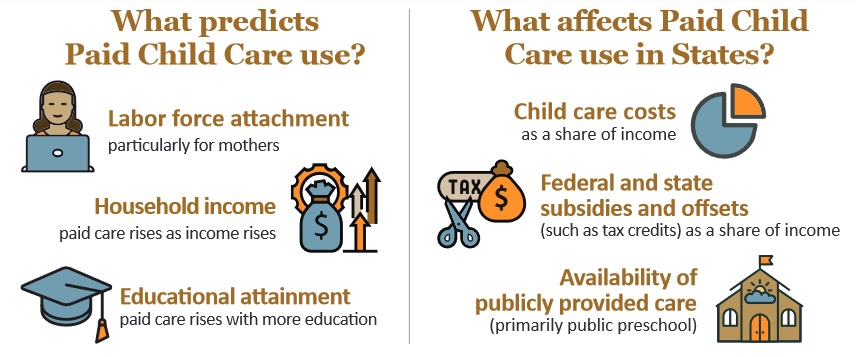
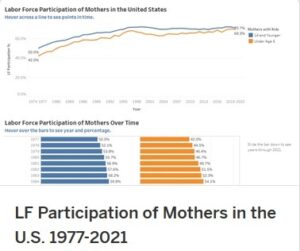
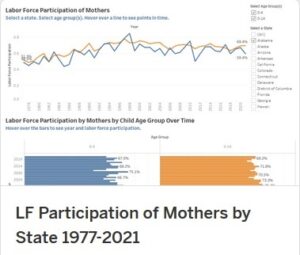
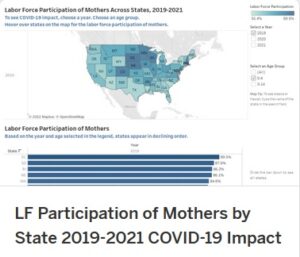
Each dashboard is based on data contained in the Committee for Economic Development (CED) report, The Economic Role of Paid Child Care in the U.S. and is designed to be interactive. Depending upon the individual dashboard, the data can be sorted by year, state (or U.S. average), age of children (e.g., age 14 and younger or under age 5), use of paid care, labor force participation of mothers, share of family income spent on child care, and household income of families using paid care compared to families with children of the same age not using paid care.
- CED New Jersey Paid Child Care Fact Sheet (who uses paid child care, average percentage of income spent on child care, average income of families who use paid child care vs those who do not, and labor force participation of NJ mothers)
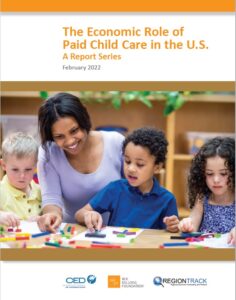
Committee for Economic Development, February 2022
Use of Paid Child Care Trends (2000 – 2020)
COVID-19 Impact: Use of Paid Child Care
Share of Income Families Spend on Child Care Trends
(2009 – 2020)
COVID-19 Impact: Share of Income Spent on Child Care
Household Income of Families Using Paid Care Compared to
Families Not Using Paid Care (2009 – 2020)
Background Resources
- The Economic Role of Paid Child Care in the U.S. (Full Report, Part 1 in the series)
- Executive Summary
- Solutions Brief
- U.S. Fact Sheet
- NJ Fact Sheet
- Infographic (The Basics)
- Infographic (Trends Over Time)
- Glossary
Labor Force Participation of Mothers Trends (1977 – 2021)
COVID-19 Impact: Labor Force Participation of Mothers
Source: IPUMS USA – University of Minnesota, U.S. Census Bureau, and RegionTrack calculations
